Understanding processes, services, and cronjobs is fundamental to understanding the inner workings of Linux systems. Each component has a distinct role within the system's overall functionality, from executing scheduled tasks to providing services to automate routine operations and enable user interaction. However, their crucial roles bring the potential for exploitation by malicious actors that have gained a foothold in the system. Attackers may exploit vulnerabilities or misconfigurations to escalate privileges, move laterally, establish persistent footholds, or install backdoors, further compromising the integrity and security of the system. As such, building a solid arsenal of forensic analysis techniques is increasingly important to effectively detect and mitigate threats against these components
In Linux, a process is a running instance of a program. When you execute a program or command in Linux, the operating system creates a process for running that program. Each process has its unique identifier called a Process ID (PID), which helps the operating system to manage and track it.
Processes can have parent-child relationships, forming a hierarchical structure. When one process spawns another process (for example, when one shell session spawns an additional process in a subshell), the new process becomes the child of the process that created it, referred to as its parent. This relationship is essential for managing processes and resource allocation within the operating system.
Various tools and utilities can be employed to inspect the running processes on a system. Using this enumeration, we can seek to identify malicious activity or suspicious parent-child process relationships.
01 · Process snapshot
ps
The ps command is a versatile utility in UNIX-like operating systems that reports a snapshot of the active processes on the system. By default, it displays information about processes associated with the current (active running) console session, but it can also be used to gather system-wide and other user's process information. The utility retrieves this information by reading files in the /proc virtual filesystem, a hierarchical directory structure corresponding to each process on the running system. To run the command, simply type ps:
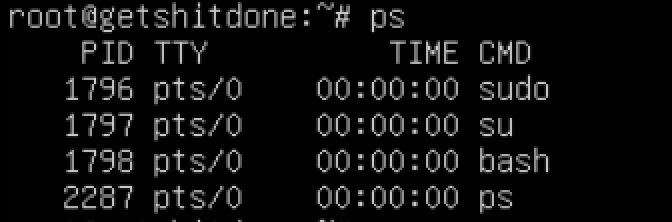
As seen above, the command provides its output in a table-like format with the following columns:
| PID | A unique identifier (Process ID) for each process. |
|---|---|
| TTY | The terminal associated with the process. |
| TIME | The cumulative CPU time consumed by the process. |
| CMD | The command associated with the process. |
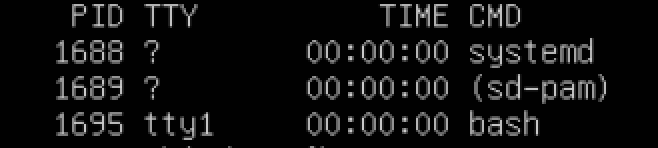
It is also possible to view processes specific to a user (Janice) by using the -u or --user option followed by the user's username:
A handy set of options to provide with the ps command is -eFH, which combines several options to return a overview of all processes running on the system in a hierarchical format, regardless of the terminal or session to which they are attached. This set of options makes it a valuable tool for system monitoring and forensic analysis:
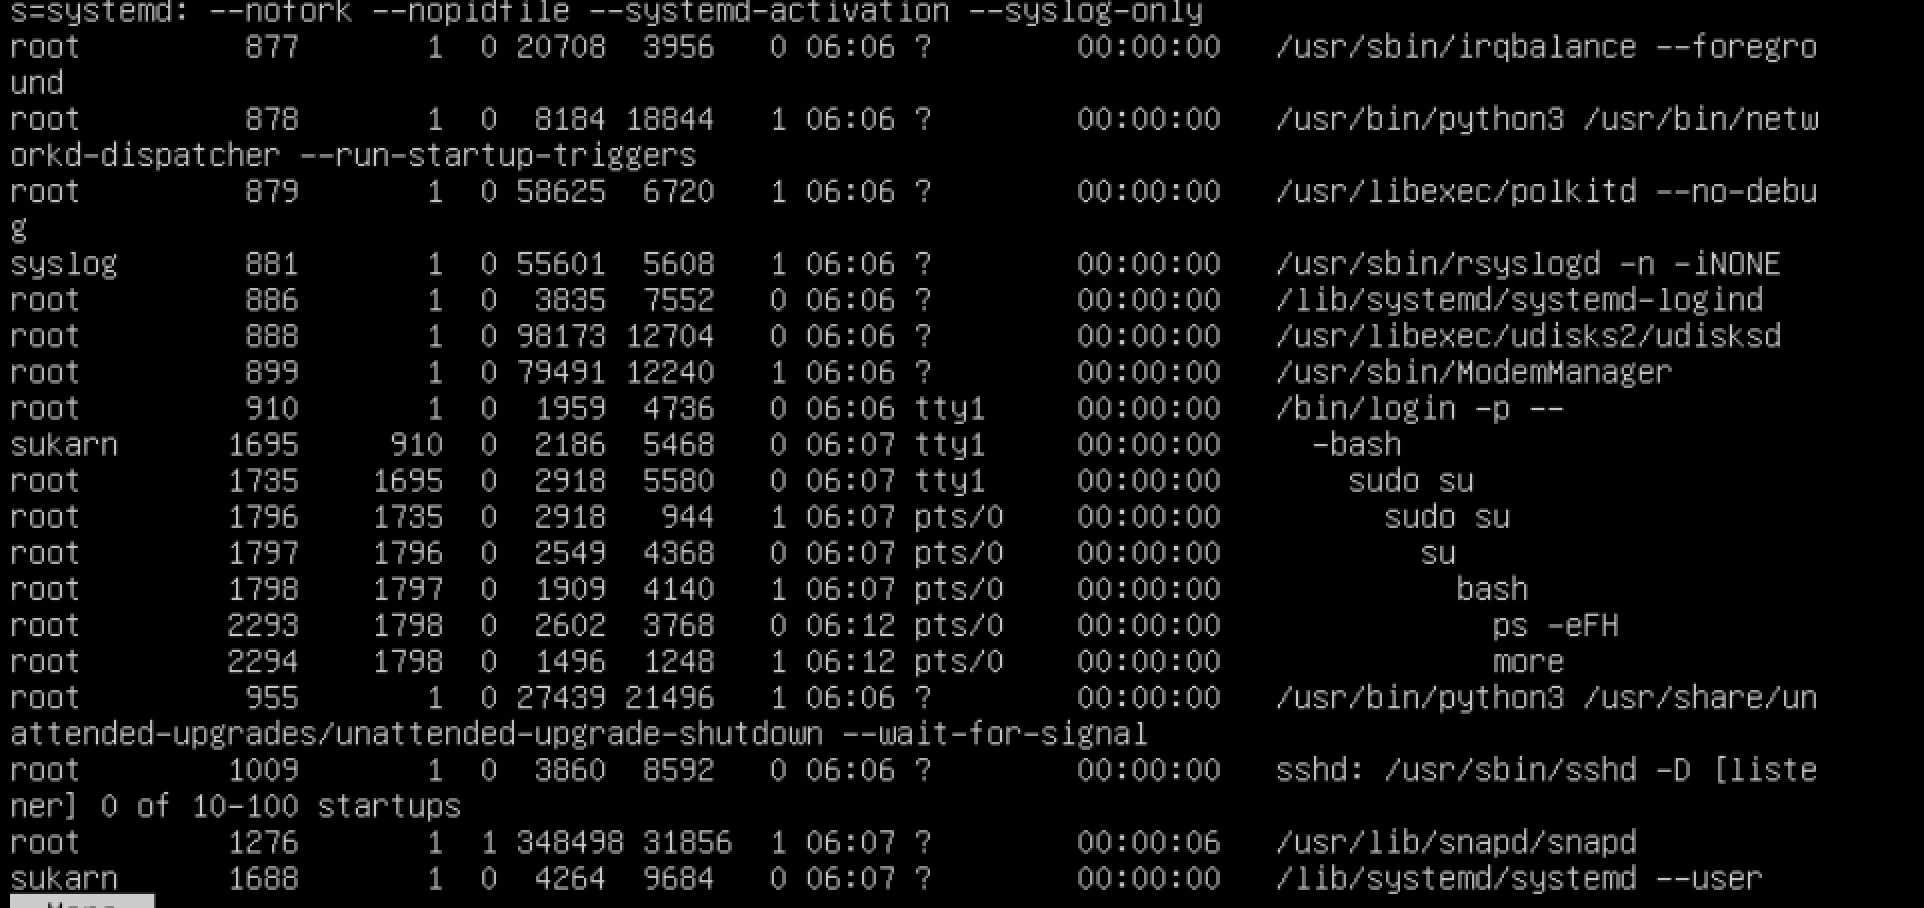
As seen in the above command, we select all processes with -e, return the results in extra full format -F, and show the process hierarchy (forest) -H.
02 · Open files
lsof
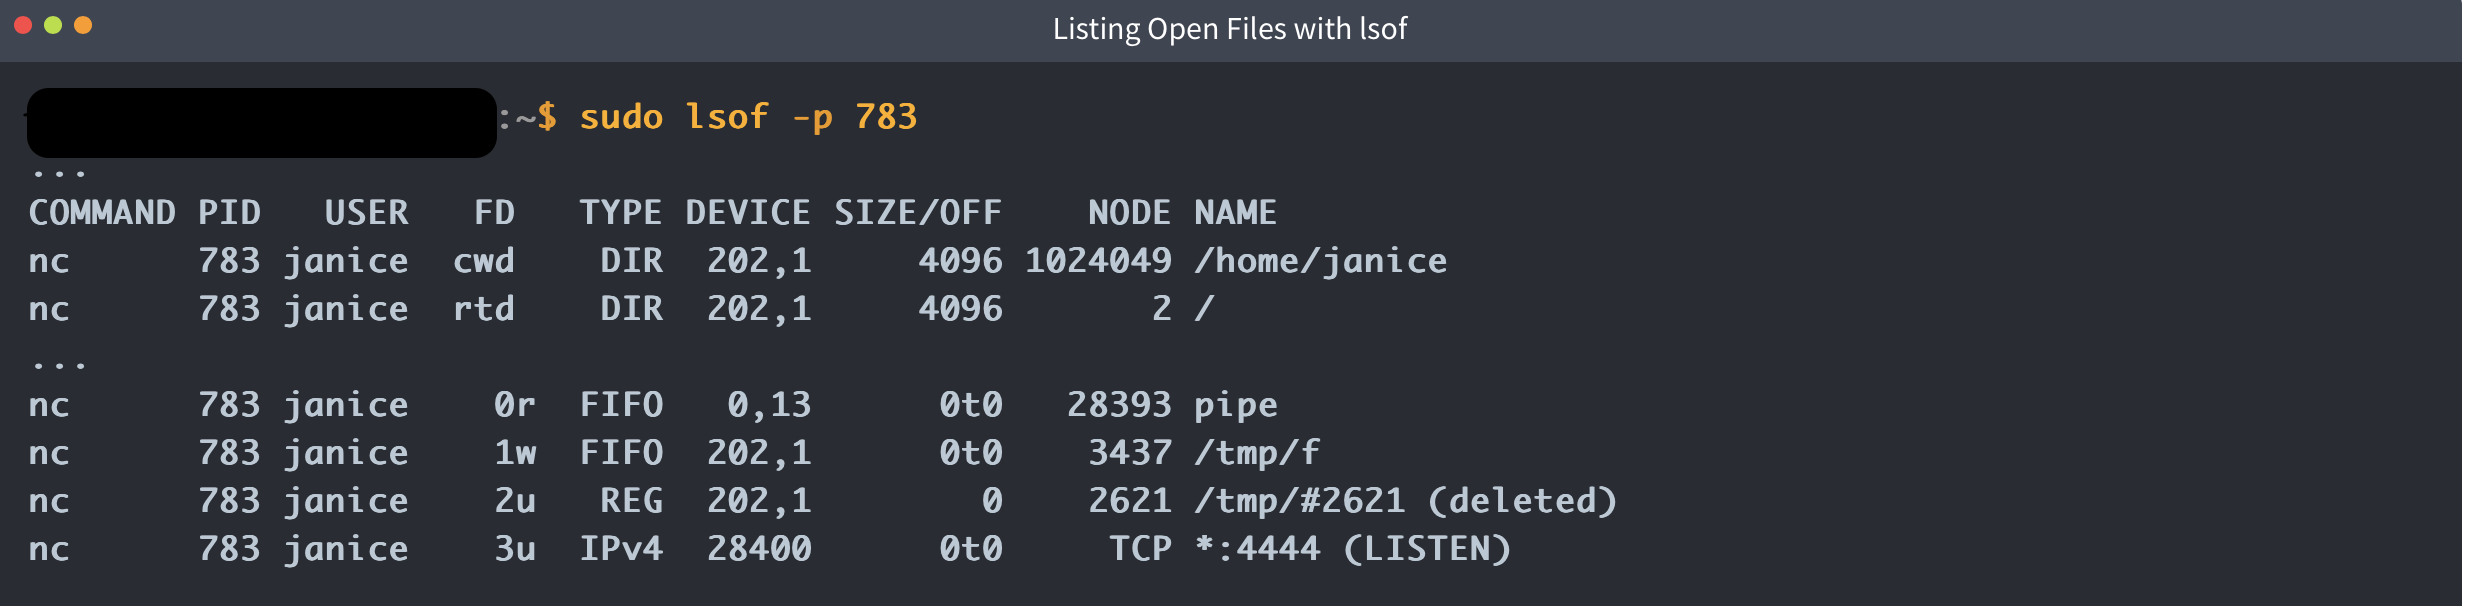
Let's explore a more powerful way to report a list of all open files and their associated processes within the running system. lsof (List Open Files) is a utility that lists information about files opened by processes on a system. In this case, to view any files open by the Netcat process we identified earlier, we can run lsof and provide the PID
Advanced Usage
1. Network Files with Specific Protocol:
lsof -i tcpExplains how to filter network connections by protocol (TCP/UDP).
1. Network Files with Specific Port:
lsof -i :80Shows how to filter by port number to see which processes are using it.
2. Files Opened by Specific Command:
lsof -c commandDemonstrates how to list files opened by a specific command.
03 · Process lineage
pstree
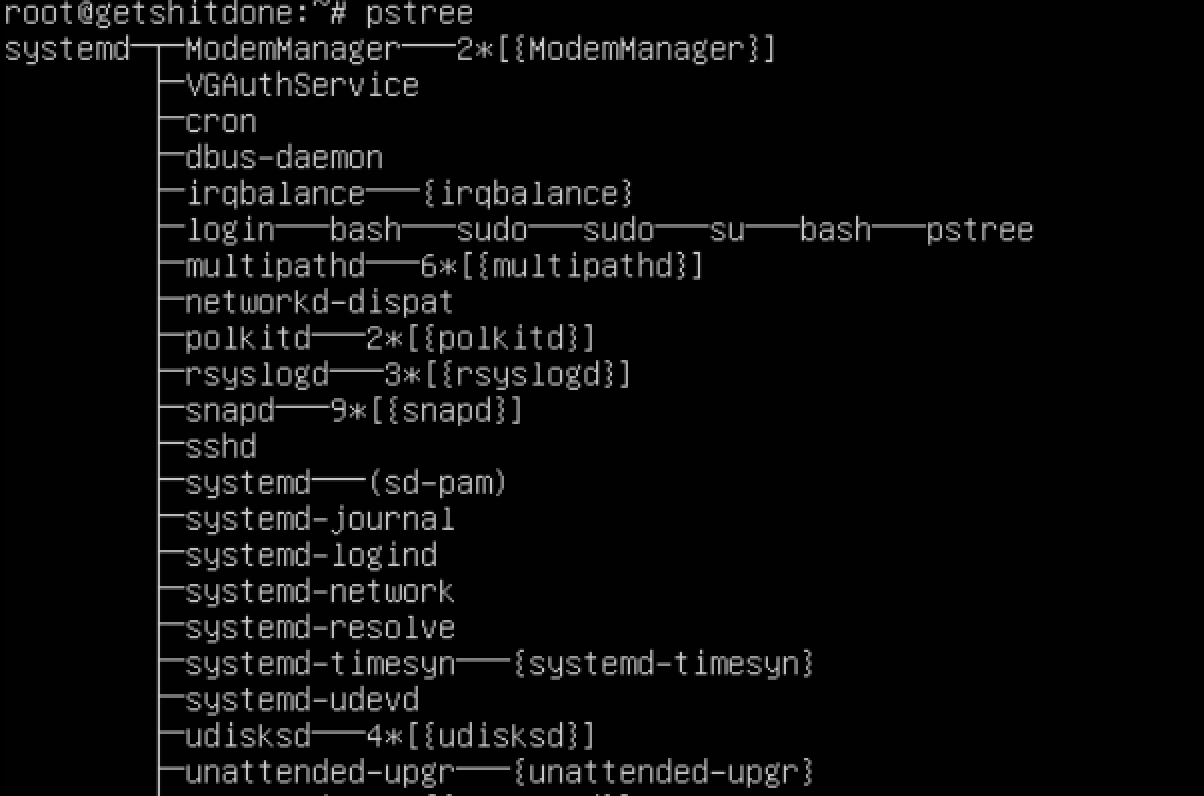
Next, we should further analyse the process of parent-child relationships using pstree. Doing so will tell us where the process originated and provide insights into potential attack vectors.
pstree is a command-line utility that displays processes visually as a tree, showing the parent-child relationships between processes. This utility can help identify the origin of the suspicious processes and understand their relationship to other processes in the system.
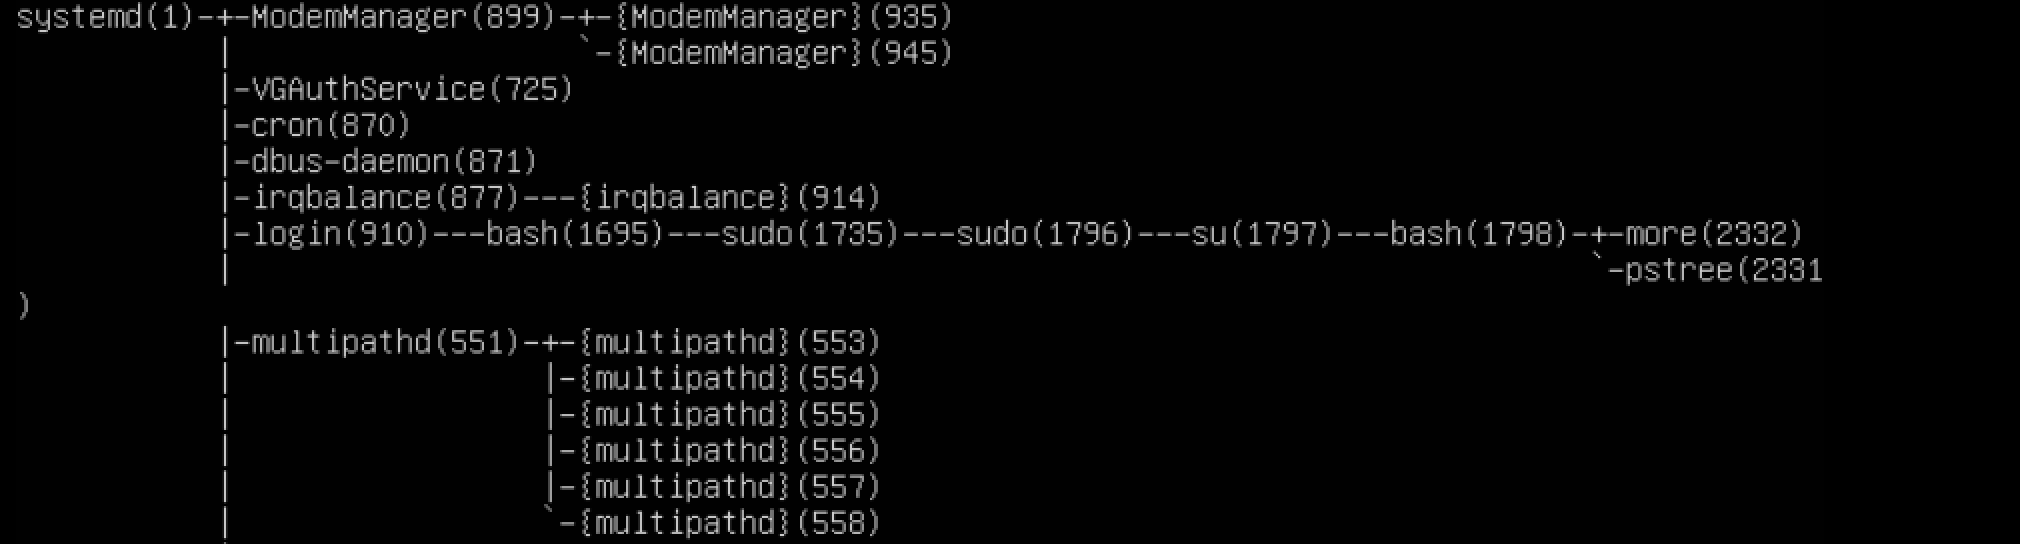
We can perform a deeper process analysis of the parent process we identified using pstree and provide options to list its parent processes (-s) and their corresponding PIDs (-p):
04 · Scheduled execution
cronjobs
Cronjobs are scheduled tasks executed automatically at predefined intervals by the cron daemon. The cron daemon is a background process responsible for managing cronjobs based on configuration files known as crontabs. Users can have their crontab file stored in the /var/spool/cron/crontabs directory. The main crontab file at /etc/crontab governs system-wide cronjobs.
Cron entries follow a specific format consisting of space-separated fields. Let's first look at an example crontab file for a user named Bob. Typically, this file would be located in /var/spool/cron/crontabs/bob:
Example Cron Entry
10 05 * * * /home/bob/backup_tmp.shThis cron schedule consists of five fields followed by the command to execute:
- Minute (10): The first field specifies the minute when the command will be executed. In this case, it's 10, indicating that the command will be executed at the 10th minute of the hour.
- Hour (05): The second field specifies the hour when the command will be executed. It's 05, indicating that the command will be executed at 5:10 AM.
- Day of the Month (*): The third field specifies the day of the month when the command will be executed. In this case, it's *, a wildcard value, meaning it will be executed every day of the month. You can also specify a specific day of the month using numbers from 1 to 31. For example, to execute the command on the 15th day of every month, you would use 15.
- Month (*): The fourth field specifies the month when the command will be executed. Here, it's also *, meaning the command will be executed monthly. You can specify months using either numbers (1 for January, 2 for February, etc.) or shorthand names (Jan for January, Feb for February, etc.). For example, you can use either 2 or Feb to execute the command only in February.
- Day of the Week (*): The fifth field specifies the day of the week when the command will be executed. In this case, it's *, which means the command will be executed every day of the week. You can also specify days of the week using numbers from 0 to 7, where 0 and 7 represent Sunday, 1 represents Monday, and so on. Alternatively, you can use the shorthand names (Sun, Mon, Tue, etc.). For example, you can use either 1 or Mon.
- Command (/home/bob/backup_tmp.sh): The final field contains the command to be executed.
Additionally, it's important to note that the system-level /etc/crontab differs from user-level crontabs. System-wide crontabs will include an additional field specifying the user under which the command will run (i.e., root or www-data).
Putting it all together, the cron schedule is configured to execute the command /home/bob/backup_tmp.sh at 5:10 AM every day.
Next, additional system cronjob directories are important for a thorough analysis. These directories are found under the /etc/ directory with the following naming convention:
/etc/cron.hourly/System cronjobs that run once per hour.
/etc/cron.daily/System cronjobs that run once per day.
/etc/cron.weekly/System cronjobs that run once per week.
/etc/cron.monthly/System cronjobs that run once per month.
/etc/cron.d/Additional custom system cronjobs.
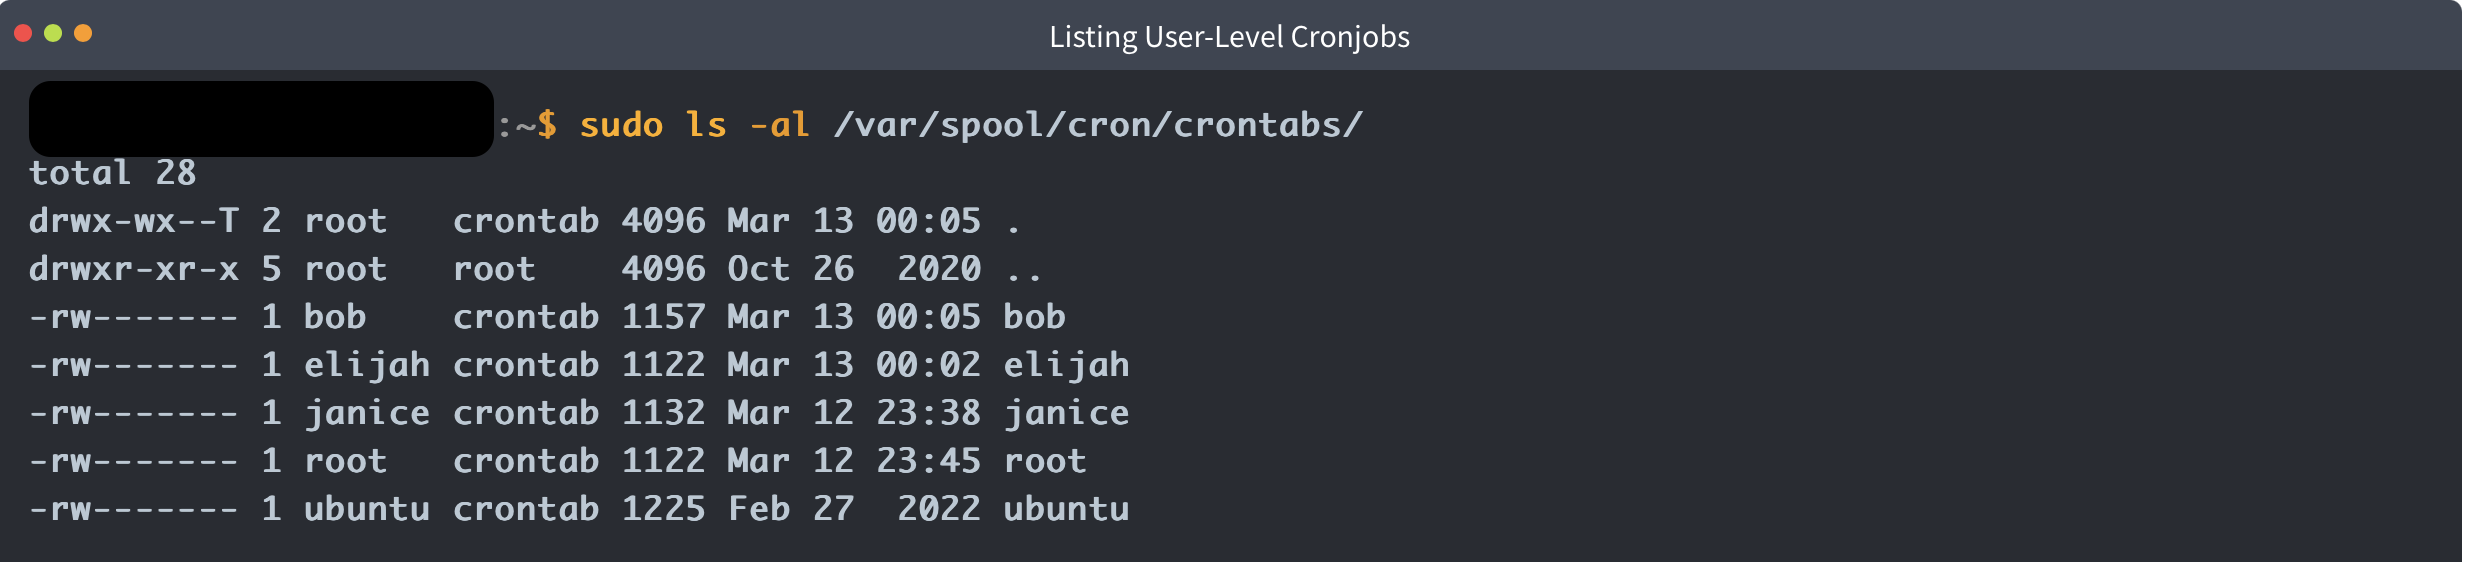
After investigating the system-level cronjobs, we can look at the various user-level cronjobs configured by users on the system. User-level cronjobs are specific to individual user configuration files and are managed independently of system-wide cronjobs. We can navigate to the /var/spool/cron/crontabs/ directory. Each user with permission to use cron will have their file inside this directory, named after their username.
There are several ways to enumerate this information. The easiest way is to list the contents of the directory with sudo-privileges:
Using a clever one-liner command, we can quickly loop through the users on the system and identify if they have any user-level cronjobs configured. If so, we can output the contents of the cronjob entry to the terminal. This type of hybrid automation can help speed up investigations and ensure thorough coverage:
sudo bash -c 'for user in $(cut -f1 -d: /etc/passwd); do entries=$(crontab -u $user -l 2>/dev/null | grep -v "^#"); if [ -n "$entries" ]; then echo "$user: Crontab entry found!"; echo "$entries"; echo; fi; done'

...
janice: Crontab entry found!
* * * * * /home/janice/abzkd83o4jakxld.sh

bob: Crontab entry found!
10 05 * * * /home/bob/backup_tmp.sh
30 04 * * * /var/tmp/findme.sh
To break down this command, we are iterating over all of the users on the system by filtering out the entries in /etc/passwd. From each of these returned users, it iterates each user and fetches their crontab entries using the crontab command we ran earlier. If a crontab entry exists for that user, we will return their username and the entry from the crontab file.
As seen in the above output, we have quickly determined the values of multiple users' crontab entries.
05 · Execution evidence
Cron Execution Logs
Cron logs record the execution of scheduled tasks managed by the cron daemon and provide a chronological record of when cron jobs were executed, along with any associated output or error messages. From a forensic standpoint, these logs can be invaluable in uncovering execution artefacts of cronjobs and lead to discovering suspicious activities or system compromises. For example, suppose a malicious actor abused an existing cronjob or created a malicious cronjob and attempted to cover their tracks. In that case, the logs might reveal unusual patterns of execution or unexpected commands being run.
On Debian-based systems, cron execution logs are typically stored in /var/log/syslog. This file aggregates system logs, including messages from the cron daemon. In some Linux distributions, such as Red Hat Enterprise Linux (RHEL) and CentOS, these logs may be found in the aptly named /var/log/cron.
Because the system we're investigating stores cron logs in the syslog file, we can grep the contents and filter for any logs related to cron:
sudo grep cron /var/log/syslogThe above command will produce a large amount of output. It is a good idea to filter the results further based on specific criteria to focus on relevant information. Some example ideas to filter on include:
sudo grep cron /var/log/syslog | grep -E 'failed|error|fatal'06 · Real-time monitoring
Pspy
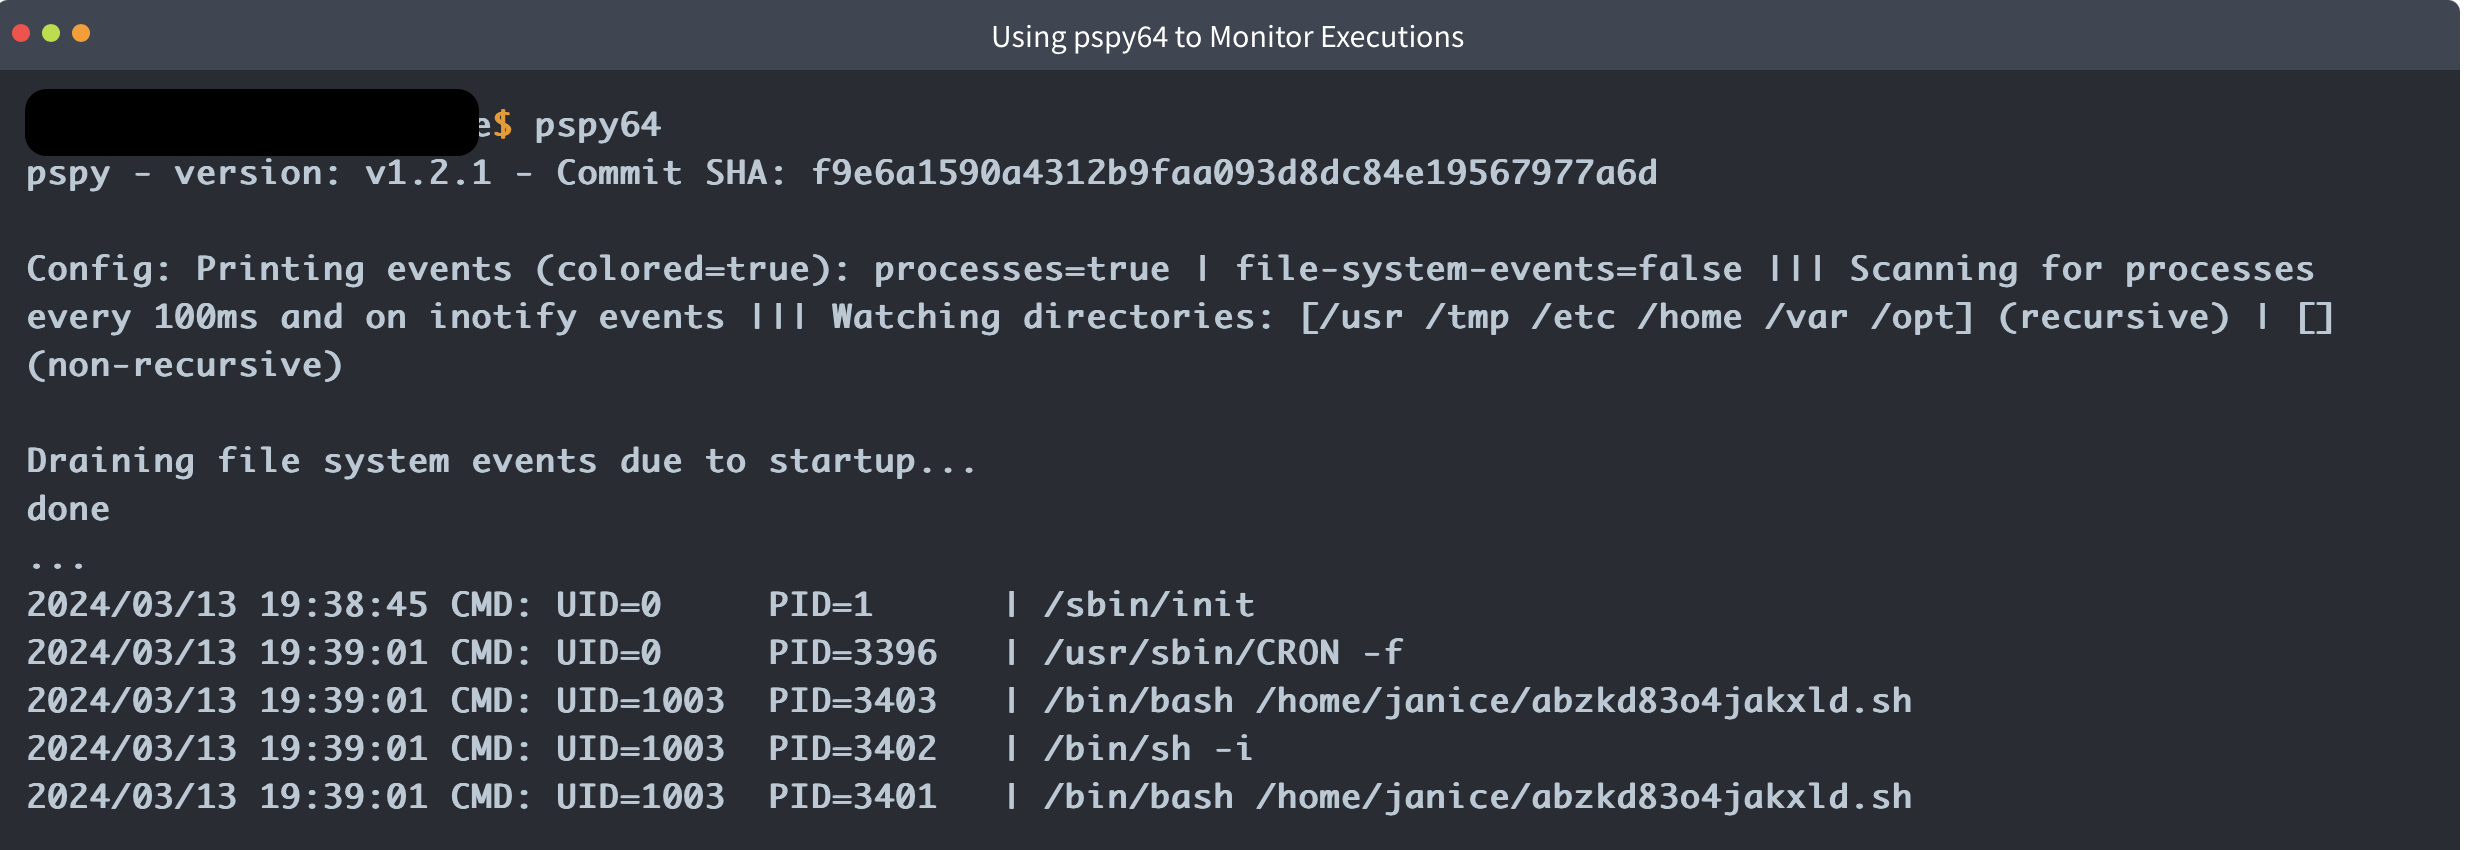
Pspy is a powerful open-source tool used to monitor Linux processes without the need for root privileges. It is designed to capture and display real-time information about running processes, including their execution commands, user IDs, process IDs (PIDs), parent process IDs (PPIDs), timestamps, and other relevant details. It operates by reading data directly from the /proc virtual filesystem, providing real-time insights into process activity without modifying system files or requiring elevated permissions.
While it's excellent for enumeration purposes, incident responders can benefit from its ability to collect execution artefacts and catch short-lived processes. Due to its real-time monitoring, it can also detect processes generated by various cronjobs through the system, giving us more insight into which processes occur when cronjobs are run.
In this system, Pspy has been pre-installed along with the mounted binaries we have been using. As such, it is in our path and can be called simply by running pspy64. It will begin to monitor in real time, and we should let it run for a few minutes to capture events. It can be stopped by pressing Ctrl + C: